Survey Analytics Complete Guide: How to Analyze Survey Responses and Extract Insights
Master survey analytics with our comprehensive guide. Learn how to analyze individual responses, generate AI-powered reports, and extract actionable insights from your survey data using advanced analytics tools.

Survey analytics is a crucial stage in understanding your audience and extracting meaningful insights from their responses. The platform offers several levels of analysis — from individual respondent reports to aggregated results and AI-generated insights. This guide walks you through all available analytics tools and how to use them effectively.
1. Basic Survey Statistics and Respondent Dialogues
When you open a survey, the platform displays an overview with key metrics:
- Survey status — Active, Paused, or Closed
- Number of participants
- Completion rate
- Number of questions
This high-level survey summary helps you quickly evaluate engagement and participation.
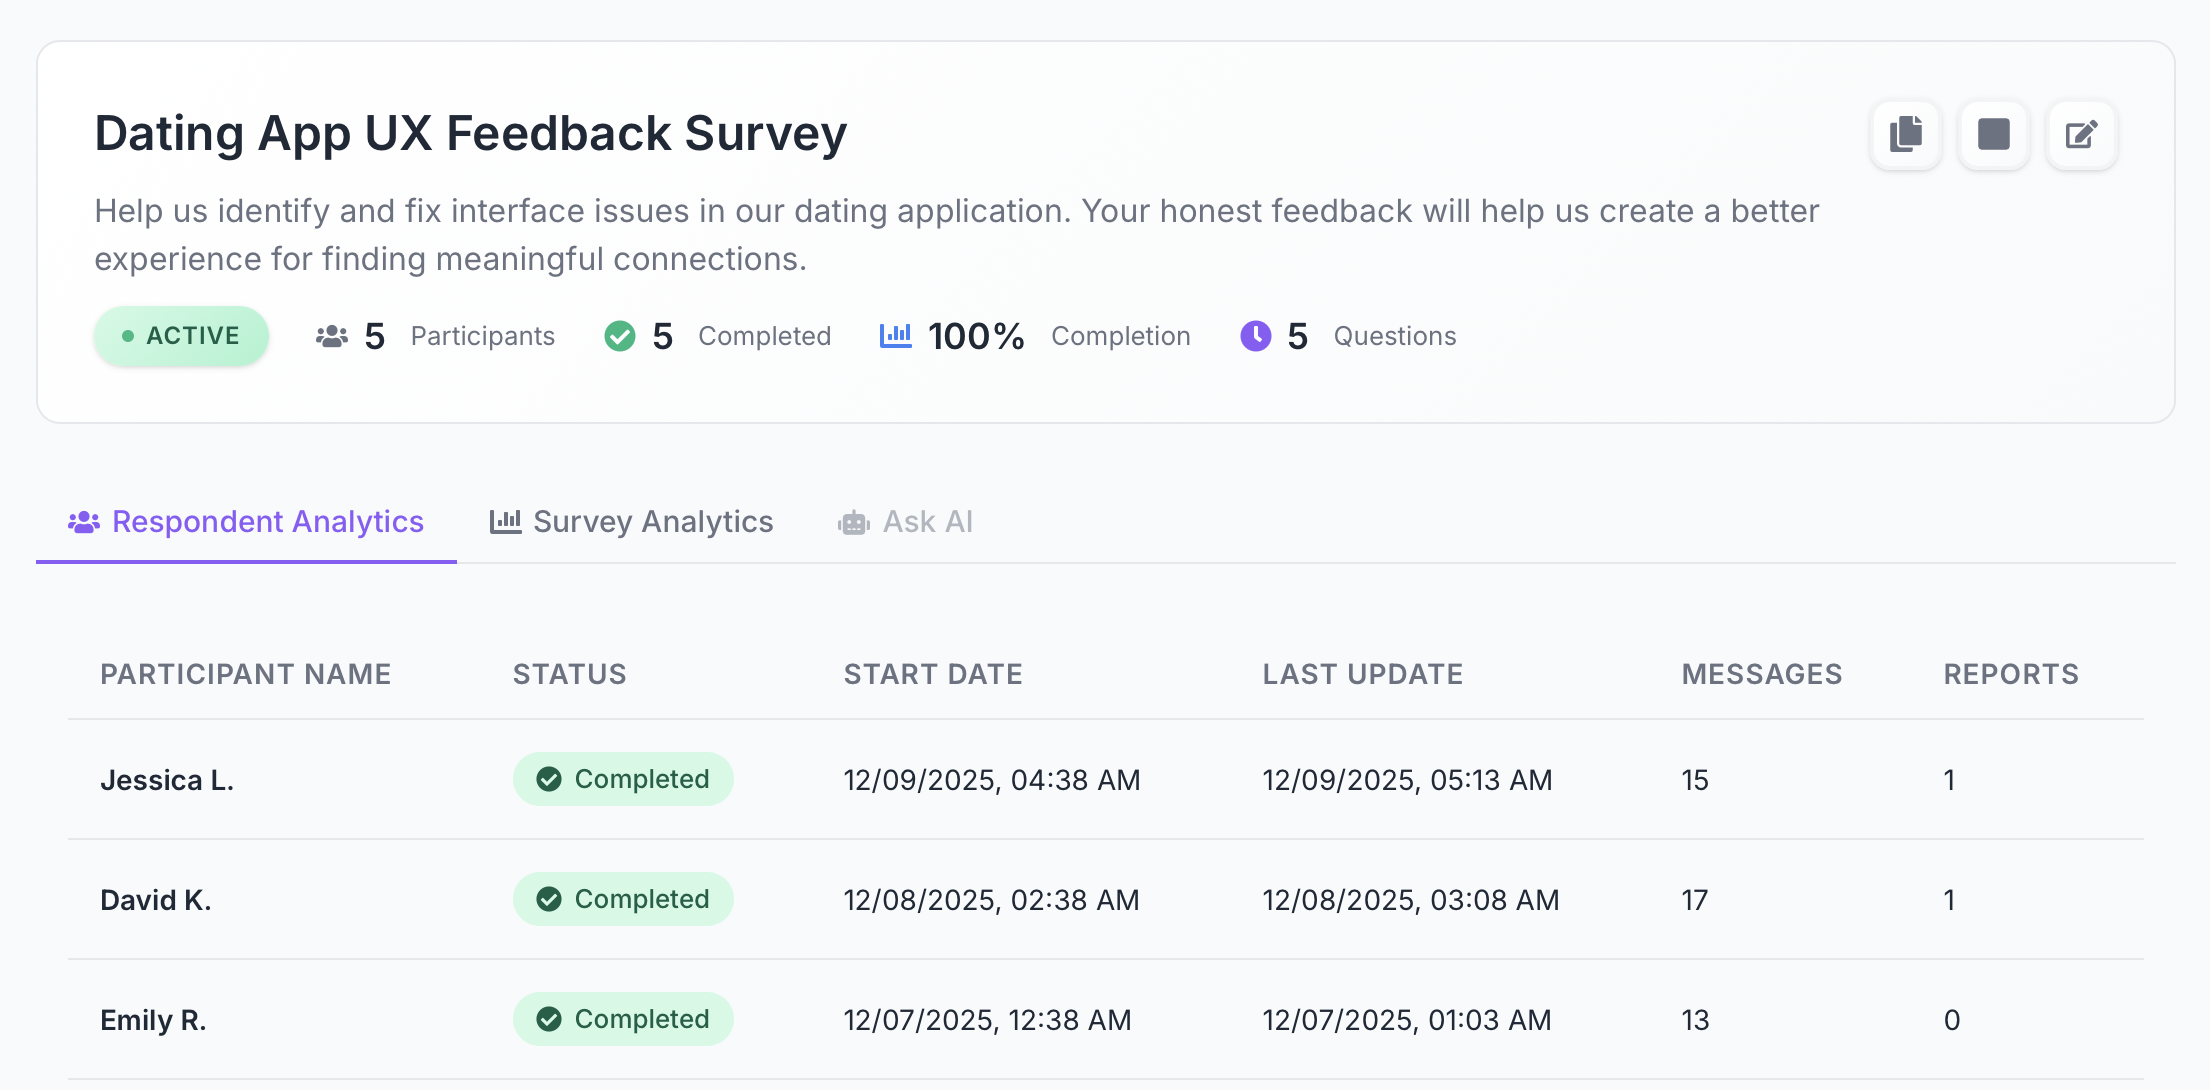
1.1 Respondent Analytics — List of All Participants
Below the summary, you'll find a respondent table showing:
- Name
- Status: Started / In Progress / Completed
- Start date
- Last activity
- Number of messages in the conversation
- Number of reports generated for this respondent
This is the first layer of respondent analytics, providing quick visibility into who completed the survey and how they interacted with the AI agent.
1.2 Opening a Respondent Profile
Click any respondent to open their detailed profile.
The Dialogue tab displays:
- the full conversational transcript,
- all questions from the AI agent,
- the respondent's answers,
- contextual follow-ups,
- both numerical and open-text responses.
This transcript is essentially a structured interview, allowing you to understand not only the respondent's answers but also their reasoning, tone, and motivations — something traditional forms cannot capture.
2. Micro-Analytics: Individual AI Reports for Each Respondent
Each respondent has a dedicated Response Analytics tab. This is where you can generate personalized AI reports based on their full conversation.
Micro-analytics help you deeply analyze a single user's feedback, emotions, and behavior patterns.
2.1 Available AI-Generated Reports
There are five types of reports you can create:
📊General Report
A universal summary of the conversation, including key insights, emotional analysis, and major takeaways.
👥HR Report
Designed for HR professionals:
- •engagement and motivation indicators,
- •burnout or turnover risks,
- •individual strengths,
- •actionable HR recommendations.
🎯Manager Report
For team leads and people managers:
- •high-level summary,
- •productivity and motivation signals,
- •actionable next steps,
- •suggested topics for 1-on-1 meetings.
💡Product Report
Focused on product discovery and user research:
- •user pain points,
- •UX insights and feedback,
- •feature requests,
- •a prioritized product backlog.
📋Business Analyst Report
Ideal for BA and technical teams:
- •functional and non-functional requirements,
- •User Stories and acceptance criteria,
- •risks and open questions,
- •clarifications needed for scoping.
2.2 How to Generate Reports
To generate a report:
- Open the respondent list.
- Click the respondent's name.
- Go to the Response Analytics tab.
- Select the report type → click Generate.
Each report is dynamically created by the AI based on the entire conversation context.
3. Macro-Analytics: Aggregated Insights for the Entire Survey
For high-level survey data analysis, go to the Survey Analytics tab.
Macro-analytics consolidate all responses and provide an overview of patterns, trends, and numerical distributions.
3.1 Analytics for Scale and Multiple-Choice Questions
Two question types are supported:
Scale Questions (1–10)
For each question, you'll see:
- •average score,
- •median score,
- •total number of responses,
- •distribution across the scale.
Multiple Choice Questions
Displayed metrics include:
- •number of respondents per answer choice,
- •percentage distribution,
- •visual charts for quick interpretation.
This helps you instantly understand overall preferences and sentiment.
3.2 AI Insights — Automated Findings From All Survey Data
This is one of the most powerful features of the platform.
AI Insights analyze:
- scale ratings,
- multiple-choice selections,
- open-text answers,
- respondent explanations,
- emotional tone,
- and the full conversational context.
When you click Generate Insights, two analytical blocks appear:
🔍Key Findings — Critical Observations
This section highlights the most important insights across the entire survey. Each finding includes:
- •severity level (Critical / High / Medium / Low),
- •a concise explanation,
- •number of mentions supporting the insight.
AI may detect:
- •missing data or insufficient sample size,
- •contradictory responses,
- •unusually strong or weak patterns,
- •lack of qualitative explanations,
- •important behavioral or emotional cues.
Example:
Critical: The dataset is too limited to form generalized conclusions; additional responses are required.
These findings help you instantly grasp the reliability and interpretability of your data.
📈Identified Trends — Patterns and Recurring Themes
AI scans all responses and reveals trends backed by evidence from dialogues.
Each trend includes:
- •a title,
- •a clear description of the pattern,
- •evidence (quotes or numerical data pulled directly from conversations).
This transparency allows you to understand not only what the trend is, but why it appears.
Example:
High scale ratings lack supporting qualitative explanations — motivations remain unclear.
These trends are especially valuable for research, HR analytics, and product discovery, where qualitative insights drive decision-making.
3.3 Regenerating AI Insights
Click Regenerate Insights to:
- refresh results after new responses are submitted,
- obtain alternative interpretations,
- update insights when survey structure changes.
AI reanalyzes the entire dataset and generates refined findings.
3.4 Segment-Based Insights — AI-Driven Audience Segmentation
In addition to statistical charts and AI-generated findings, the platform also provides Segment-Based Insights — an advanced macro-analytics feature that automatically groups respondents into meaningful segments based on their behavior, priorities, and conversation patterns.
This tool helps you understand not just what respondents said, but which types of users exist within your audience and how they differ.
How segmentation works
AI analyzes:
- response patterns,
- tone and intent in dialogues,
- shared frustrations or motivations,
- common priorities and decision criteria,
- behavioral signals from the conversation flow.
Based on these patterns, the system groups respondents into distinct clusters and generates insights for each segment.
What each segment includes
Every identified group displays:
- Segment name (e.g., "Technical Complainers", "Efficiency Seekers")
- Number of respondents in the segment
- Short behavioral profile explaining their characteristics
- Key Insights, highlighting:
- •what motivates them,
- •what blocks them,
- •what could improve their satisfaction,
- •what they value most.
Example:
- •Technical Complainers — users limited by technical issues but likely to become advocates if stability improves
- •Efficiency Seekers — goal-oriented users wanting better filtering and faster matching
- •Communication Focused — users frustrated by message organization and notification clarity
These insights help teams understand why different groups behave differently.
Why Segment-Based Insights matter
This feature adds a new dimension to macro-analytics:
- Product teams spot clusters with distinct needs and can prioritize improvements.
- Marketing teams get clearer user personas for targeted messaging.
- HR and research teams can differentiate sentiment across internal groups.
- Executives gain a strategic view of audience segments and what drives each group.
Segmentation transforms raw survey responses into structured personas, making strategic decision-making faster and more evidence-based.
Conclusion: Multi-Level Analytics for Deep Understanding
The platform's analytics capabilities combine individual respondent insights with aggregated survey-wide data, powered by AI that understands both quantitative metrics and qualitative context.
From reading detailed conversation transcripts to generating specialized reports for HR, product, or business analysis — the platform gives you complete visibility into your survey data.
Whether you're conducting employee engagement surveys, product research, or customer discovery, these analytics tools help you extract actionable insights that drive better decision-making.
Ready to unlock deeper insights from your surveys?
VibeSurvey's analytics tools help you understand not just what respondents say, but why they say it. Start getting actionable insights today.